
PanorOmics is a web-based resource that contextualizes the genomic alterations detected in personal cancer genomes by looking at them in the light of the clinical and scientific evidence available for 26 tumor types. Additionally, it provides information about the molecular context of mutations by mapping them on the structure of proteins and interactions in the human interactome.
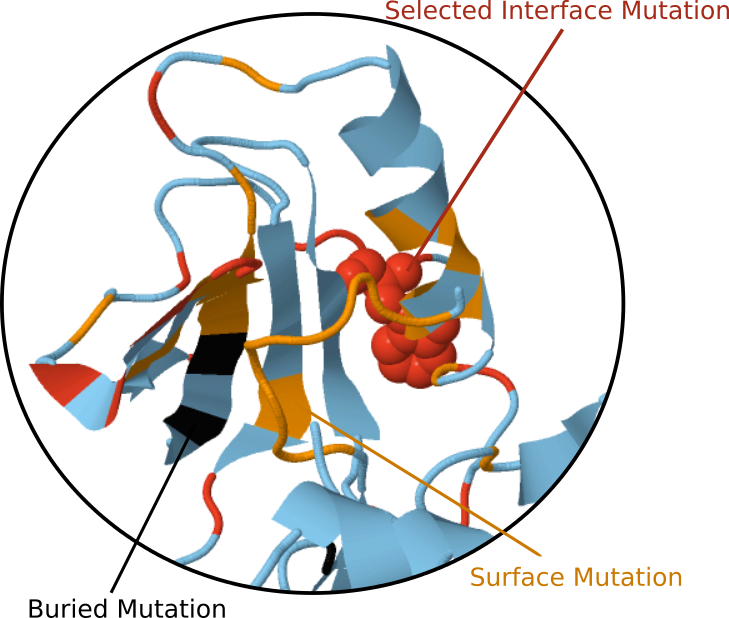
By mapping mutations on the human structural interactome we can classify them based on the position they have inside the structures as buried, surface or interface mutations. Their position inside the interactome determines if they affect the nodes in the network (buried or surface mutations) or the edges (interface mutations).
The contextualization of your findings using PanorOmics will provide you detailed relevant information destilled from the huge amount of data generated by high-throughput methods. Together with appropriate genetic counseling and/or the medical advice from molecular tumor boards at the clinical onset, the visualization of genomic alterations in PanorOmics can contribute to the identification of actionable alterations guiding the clinical decision-making process.
The results are shown in an interactive graphical interface that can also be used to report the most relevant findings directly to the patients undergoing genomic testing, whose information and empowerment should play a central role in personalized cancer management.
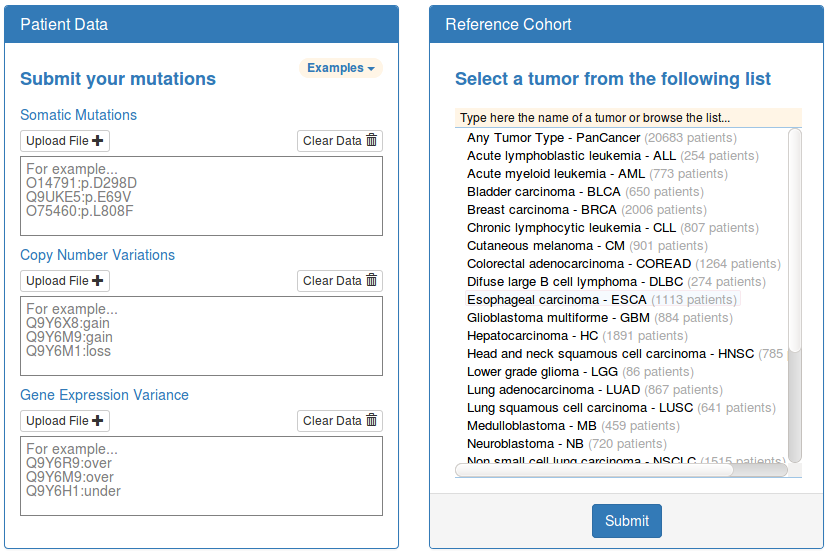
You can upload your list of somatic mutations, copy number alterations and/or gene expression alterations detected in a personal cancer genome in the input boxes located on the right panel of the home page. Before submitting the query, you should also choose one of the 26 tumor types available as reference cohorts from the list located on the right panel of the same page.
![]()
Please, make sure the format of the input fulfills the following requirements:
- Every protein should be submitted in a separate line
- Each line should contain the identifier of the protein (uniprot accession code preferred) followed by a semicolon and the genomic alteration detected in that protein.
- Somatic mutation nomenclature should follow the HGVS recommendations using the 1-letter aminoacid(s) code (e.g BRAF:p.V600E).
- Copy number variants are denoted by the keywords “gain” or “loss” (e.g TP53:loss).
- Gene expression variants are denoted by the keywords “over” or “under” (e.g EGFR:over).
- IMPORTANT NOTE: The uniprot accession code is the preferred identifier, although HGNC gene symbols are also accepted. You will receive a warning if the conversion from HGNC gene symbol to uniprot accession code generates an ambiguous mapping or if the aminoacid affected by the somatic mutation does not correspond to the reference aminoacid in the specified protein coordinates.
PanorOmics provides a contextualized view of the genomic alterations you uploaded within the available information for the tumor type of interest. Your list of genomic alterations can be visualized using two complementary perspectives that are described below: a “Patient Centric View” and a “Cohort Centric View”.
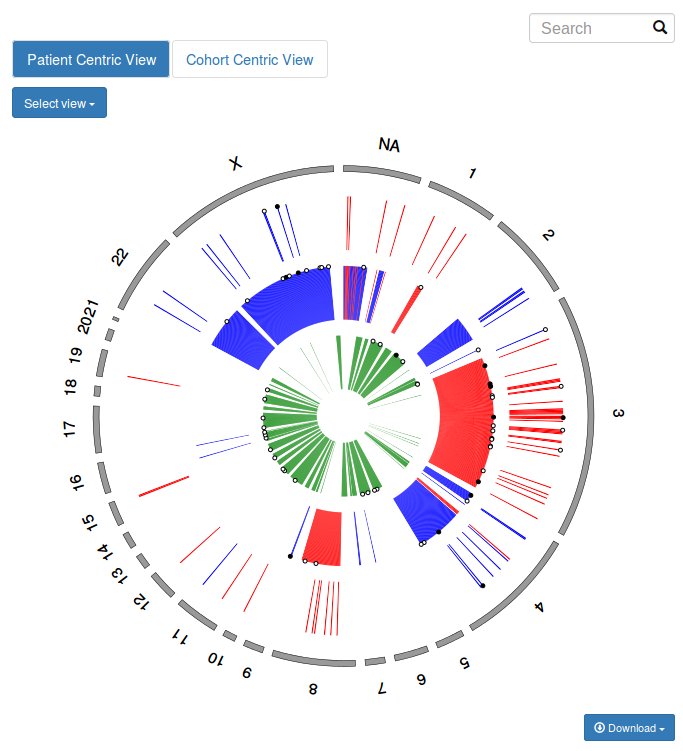
In the Patient Centric View all proteins altered in the patient are sorted by chromosomal coordinates and displayed in an interactive circular layout. The outermost ring, in gray, indicates the chromosomal location. Somatic mutations are represented as green cells in the inner data track, copy number and gene expression alterations are represented as red or blue cells in the second and third data tracks. Black circles are used to map known driver genes on patient alterations (filled circles indicate tumor type specific drivers whereas empty circles indicate drivers in any other tumor type).
![]()
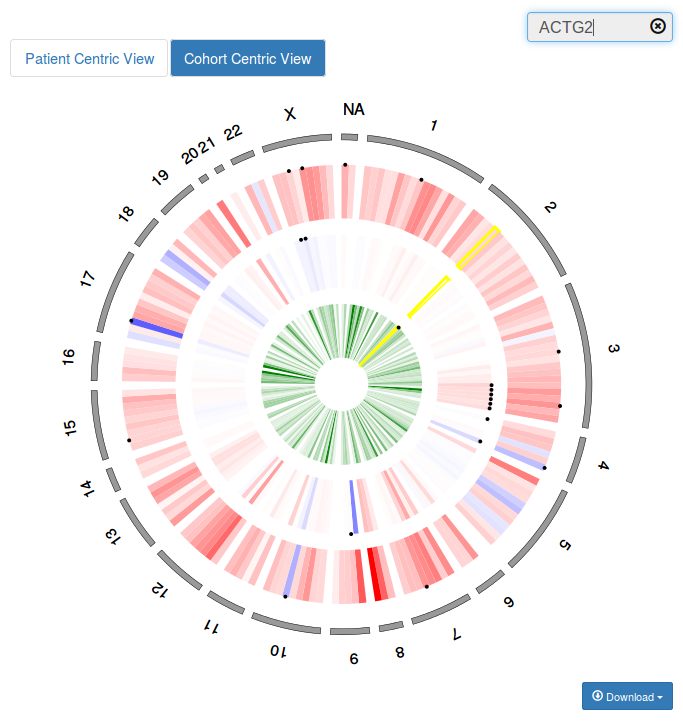
In the Cohort Centric View all known tumor type specific drivers according to IntOGen are sorted by chromosomal coordinates and displayed in an interactive circular layout. The outermost ring, in gray, indicates the chromosomal location. The color scales indicate how often a protein is affected by each type of genomic alteration in the reference cohort. Somatic mutation frequency is represented in green in the inner data track whereas copy number and gene expression alteration frequencies are represented in a red-white-blue scale in the second and third data tracks. Black circles are used to map patient genomic alterations on know driver genes.
![]()
The circular display is interactive and allows you to see the details of each protein in a dynamic table in the top right panel by just passing the mouse over the corresponding cell. You can also get a closer view of a chromosomal region by choosing the corresponding chromosome in the dropdown menu “Select View”. You can look for your protein(s) of interest using the search box at the top right corner. Finally, you can click on any genomic alteration to visualize it within its molecular context.
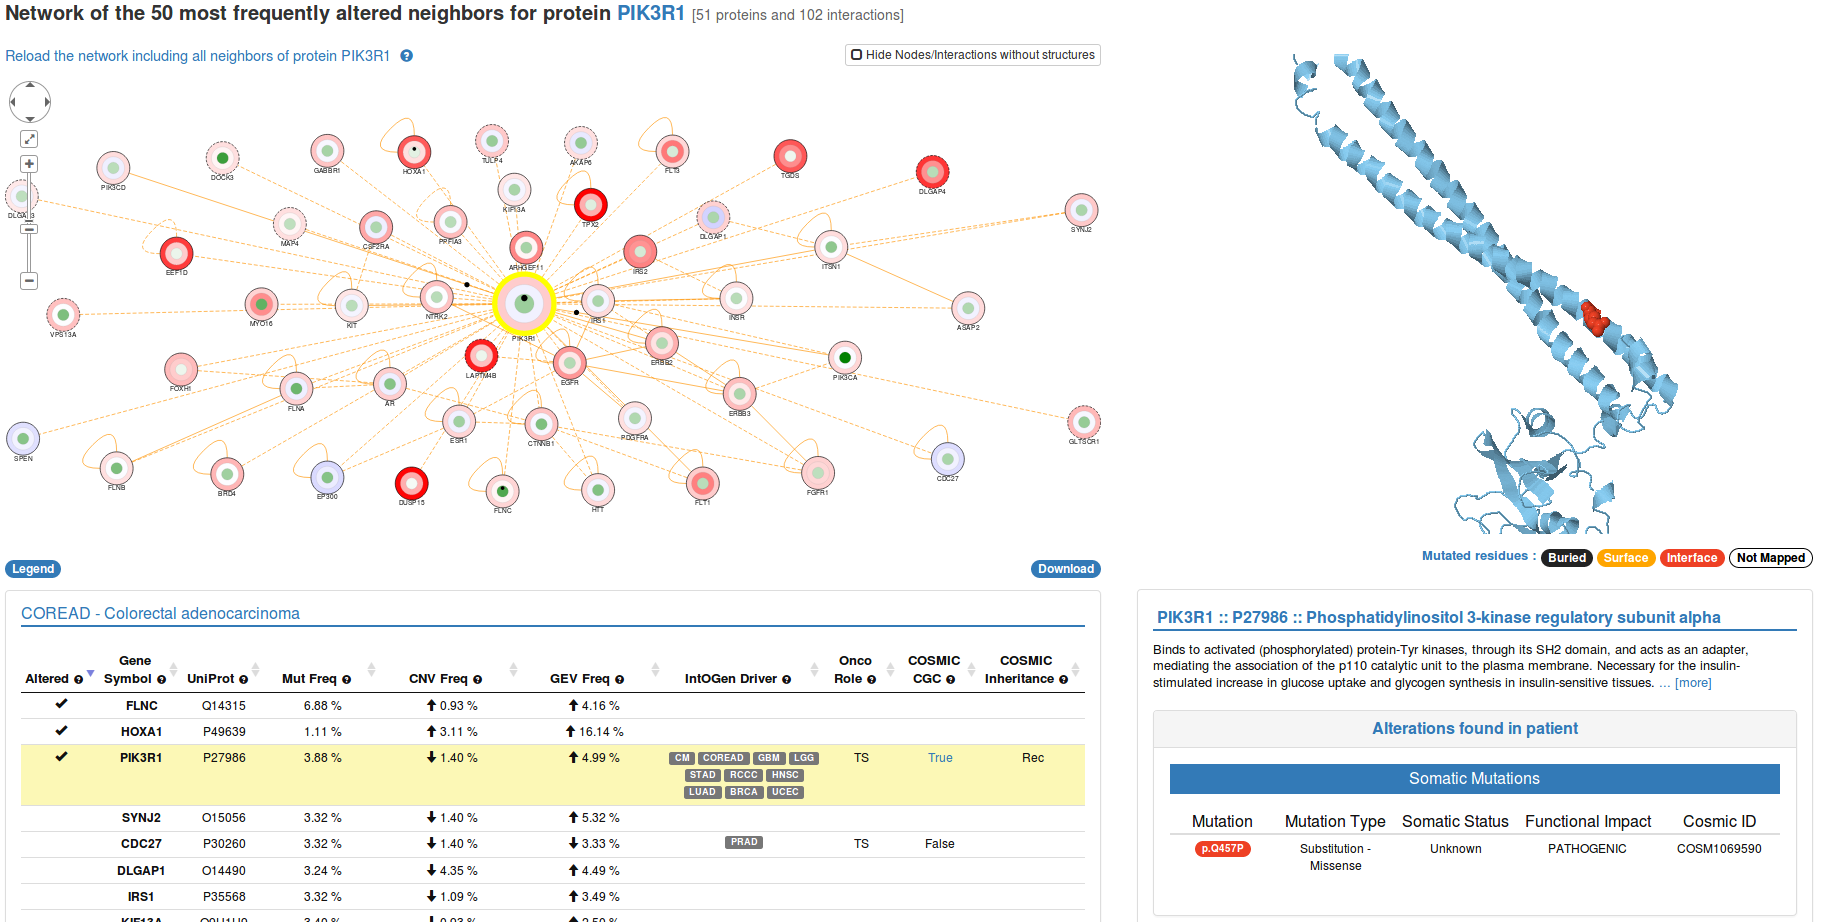
The page showing the molecular context of the protein you selected in the “Patient Centric View” or “Cohort Centric View” will be similar to what is shown in the following image.
![]()
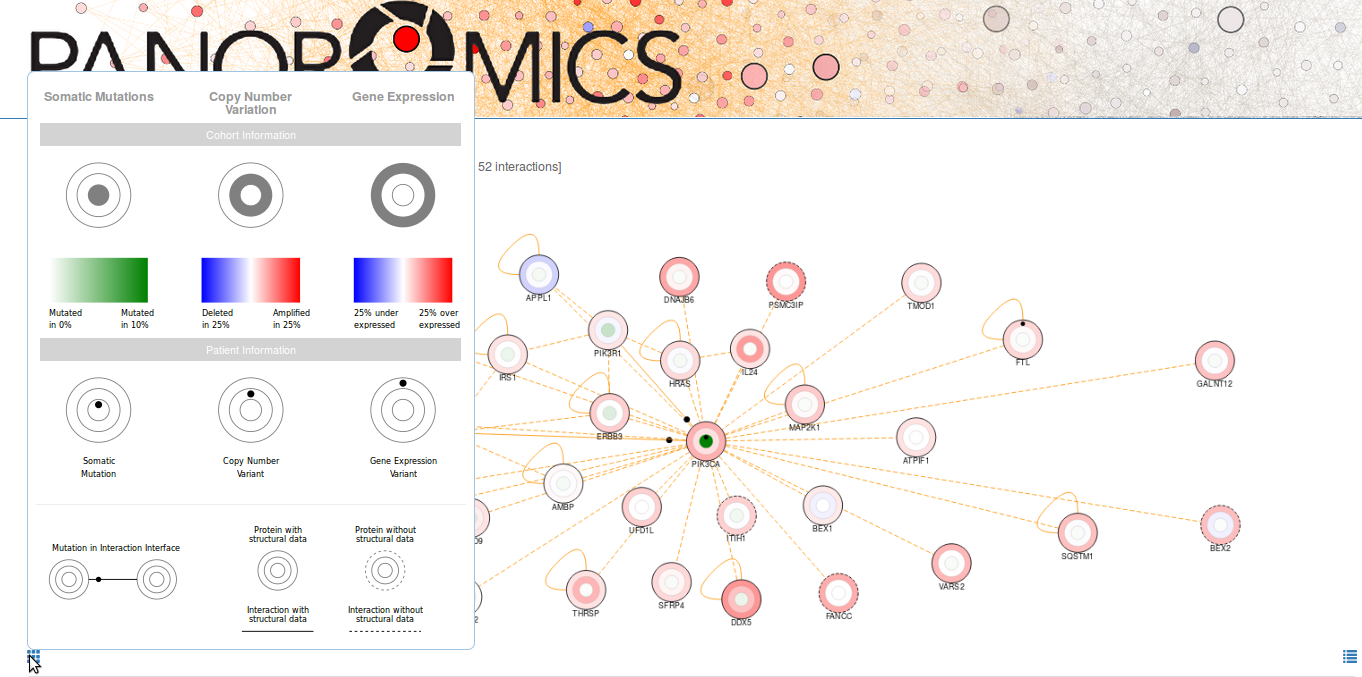
At the top of the page you can find an interactive representation of the network neighborhood of your selected protein. Nodes in this network represent proteins while edges represent protein-protein interactions (PPIs) deposited in Interactome3D. When you click on a node in the network (e.g PIK3CA in the image), the corresponding protein is highlighted in the table below. In addition, the structural information available is displayed in the right panel.
Small black circles indicate the presence of a genomic alteration either on a protein or at the protein-protein interaction interface between two proteins. Every node contains three concentric discs:
- The inner disc contains a black circle if you detected a somatic mutation in that protein and its color reflects the somatic mutation frequency in the reference cohort. It is IMPORTANT to note that a single small black circle might represent more than one somatic mutation if they affect the same protein.
- The middle disc contains a black circle if you detected a copy number variant in that protein and its color reflects the copy number alteration frequency in the reference cohort.
- The outermost disc contains a black circle if you detected a gene expression alteration in that protein and its color reflects the gene expression alteration frequency in the reference cohort.
A legend is displayed as you mouseover the button located at the bottom left corner of the network view. You can download an image of the current view by clicking on the button at the bottom right corner.
![]()
Below the network view, you can find a table showing detailed information about all the nodes in the network. Basically, it summarizes the evidence available to link each protein with a known or potential role in cancer. A detailed explanation of each of the fields is displayed as mouseover pop-ups.
If a node or edge is represented with a solid line in the network you can click on it to display the available structural information in the right panel. On the contrary, a dashed line indicates that there is no structural data available to be displayed.
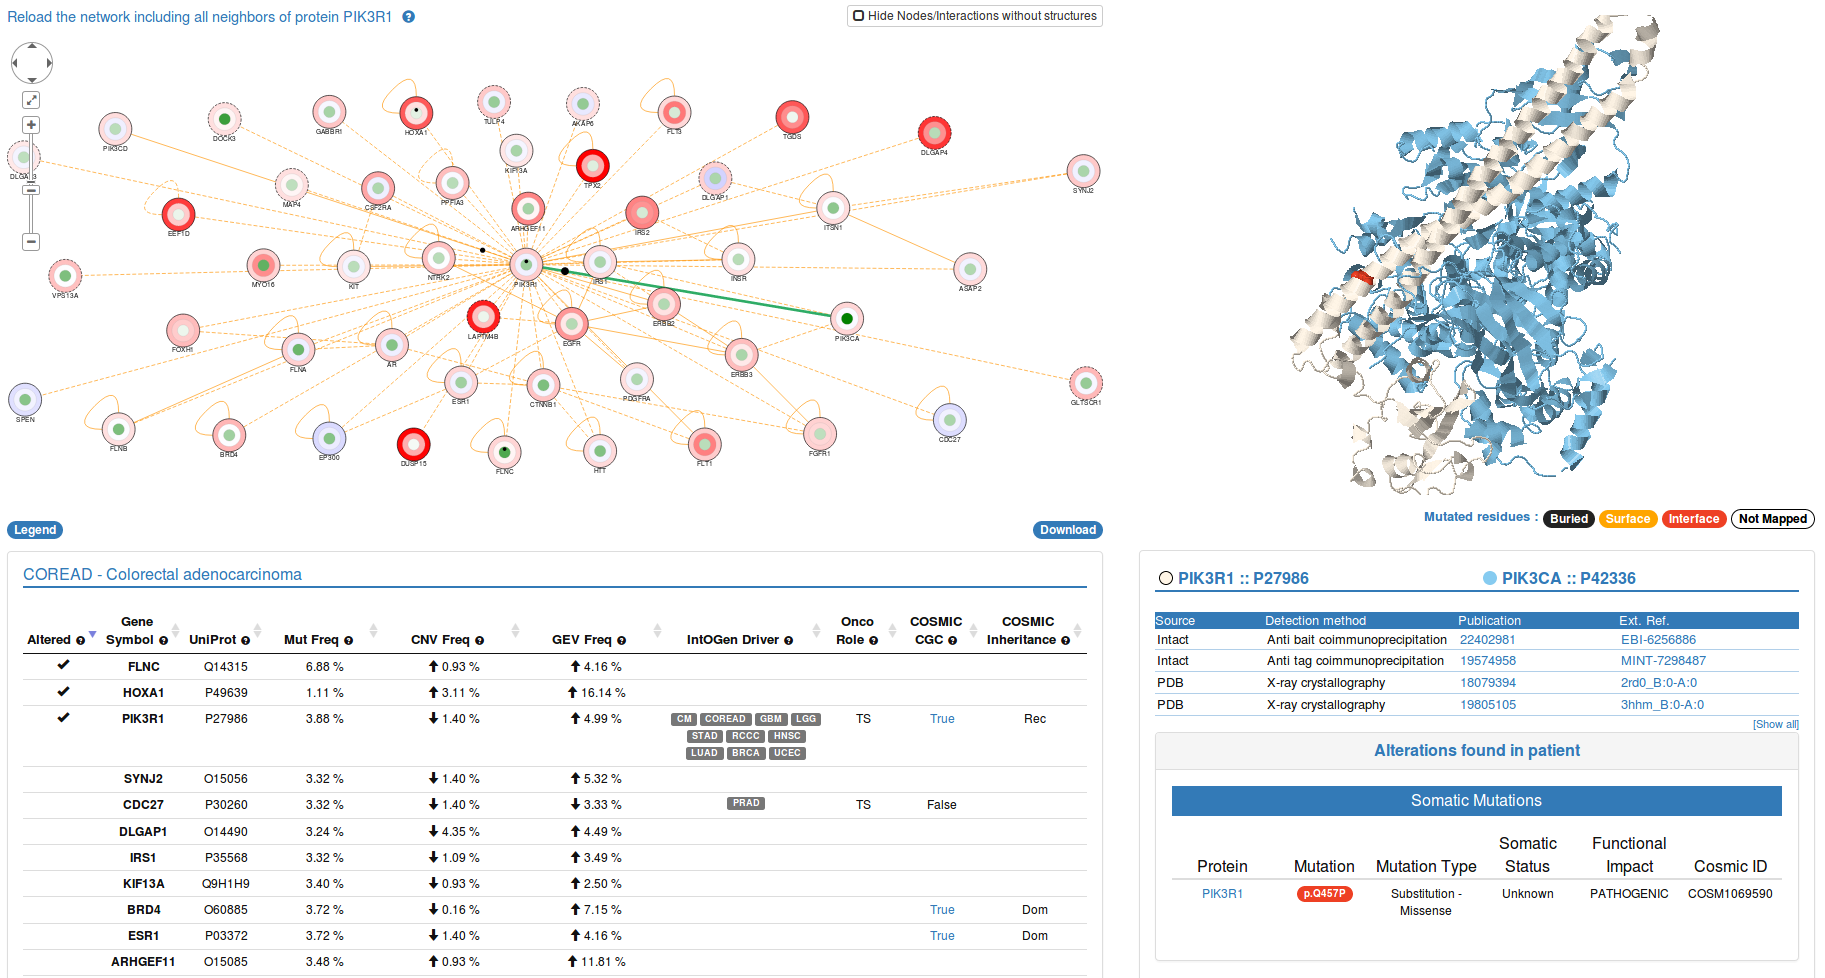
![]()
The JSmol view at the top of the right panel is interactive: you can move and zoom the structure using the mouse. Mutated residues are highlighted with a sphere representation and are colored based on the position they have inside the structures as buried, surface or interface mutations.
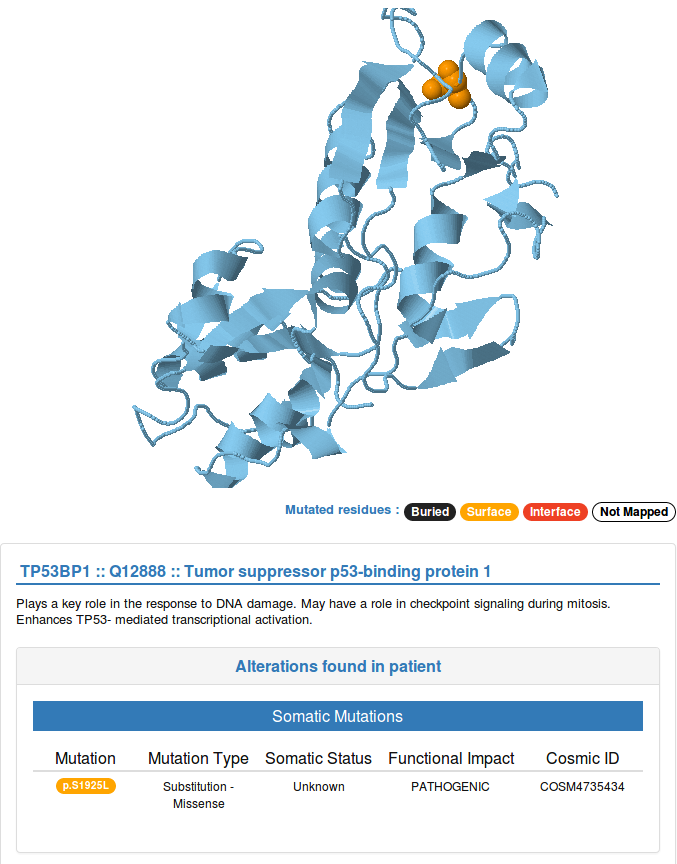
A brief description of the protein function is shown below the structural representation of single proteins. In case you selected a protein-protein interaction, you will see the method used to identify the interaction. Below this information, you will find a table providing additional details about the genomic alteration(s) you detected in the selected protein(s), such as the mutation type, somatic status and FATHMM predicted functional impact for those mutations that correspond to known mutations in COSMIC.
![]()
After showing the details about the genomic alteration(s) detected in your dataset, we also provide a list of all the mutations detected in other patients of the same reference cohort that were mapped to the same protein or protein-protein interaction interface. This way you can see whether the mutation you detected falls in a region of that protein that is also mutated in other cancer patients. Note that when you are visualizing an interaction interface, only mutations occurring at the protein-protein interaction interface will be displayed.
In the blue box below, you can find details about the structure currently shown, together with a button for downloading the corresponding PDB file and a link to the corresponding entry in Interactome3D.
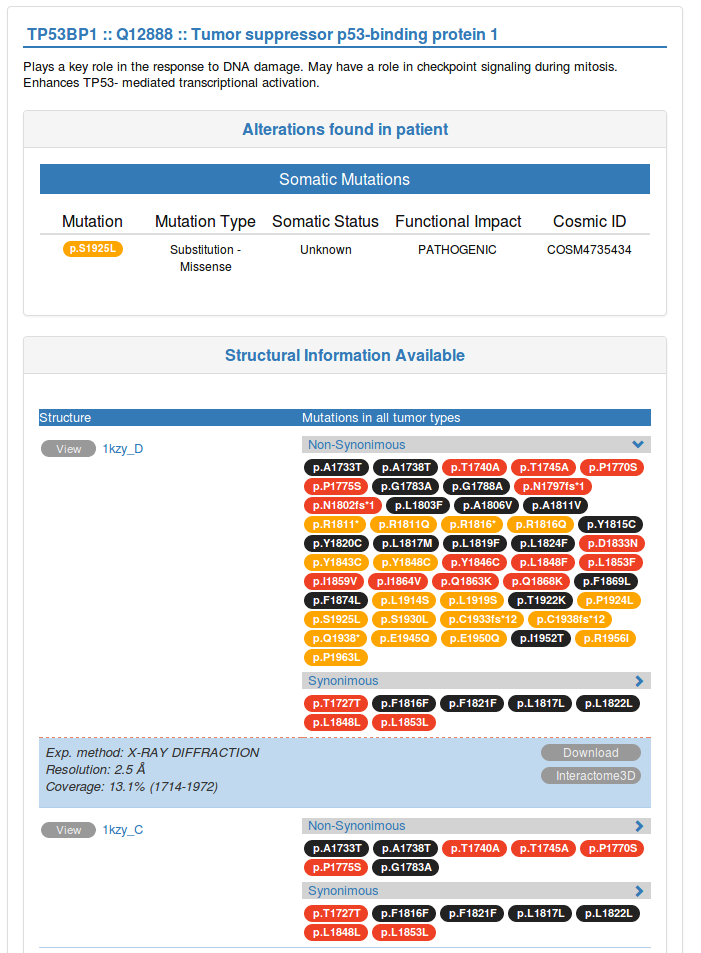
![]()
You will find all this information each of the structures and models available for that protein. By clicking on the view button (at the left) you will display the corresponding structure in the JSmol view above. Be aware that, by default, only the first 4 structures are shown. If you want to show all the structures available you can click on the link at the bottom of the table.